


A real-time workforce command center for Amazon Connect — a Tampermonkey userscript that intercepts the Connect Analytics API live and turns raw agent data into a draggable, black-and-gold monitoring panel for RTAs, WFM, ops managers, and team leads. No external APIs, no backend, no databases.
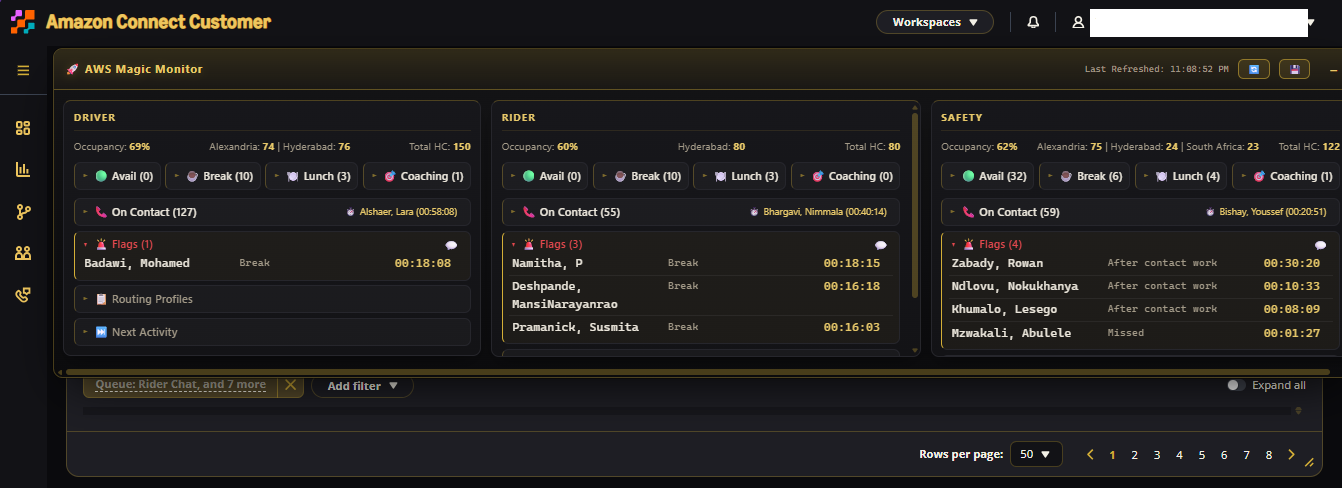
Everything runs on data the dashboard already loads — the script sits on the Connect Analytics fetch calls, boosts the page size to 1000 agents per pull, and re-renders on every refresh without touching a server.
| Area | What you get |
|---|---|
| 🔴 Live monitoring | Fetch-level API interception, auto re-render on dashboard refresh, per-queue cards |
| 📊 Queue analytics | Occupancy % (active slots / capacity), total HC, location breakdown |
| 🟢 Agent visibility | Available / On Contact / Break / Lunch / Coaching chips, state durations, longest active contact per queue |
| 🚨 Compliance flags | Configurable thresholds, flagged agents auto-expand, per-queue flag export |
| 📋 Routing profiles | Distribution counts per routing profile per queue |
| ⏭️ Next activity | What each agent is queued to do next, grouped and sorted |
| 💾 CSV export | One click → Agent_RealTime_Status.csv of the entire pull |
| 🖱 UI | Draggable, resizable, collapsible panel · gold-on-black executive theme · toasts |
| State | Flag threshold |
|---|---|
| Break | > 16 min |
| Lunch | > 31 min |
| Coaching/Feedback | > 31 min |
| Meeting | > 31 min |
| Missed | any (> 1 s) |
| After Contact Work | > 8 min |
Flag rules are trivially editable in the source — tune them to your operation.
- Intercept — the script wraps
window.fetchand watches for Connect Analytics requests carryingAGENT+CHANNELmetrics. - Boost — outgoing payloads are rewritten to
pageSize: 1000so the pull covers the whole floor instead of one page. - Extract — agent name, state, state duration, routing profile, group, next state, and active/capacity slots are parsed per row.
- Aggregate — agents group by routing profile → occupancy, chips, flags, and profile distributions are computed per queue.
- Render — queue cards update in place; data is also mirrored to
localStoragefor companion tooling.
The distribution build is not yet published. When released, it will be a one-click install; steps below.
- Install the Tampermonkey browser extension
- Install AWS Magic Monitor from the release/raw link (coming soon)
- Open your Amazon Connect dashboard and load the real-time agent metrics view
- The 🚀 panel appears top-left — drag it anywhere
- Drag the header to move · − / + collapses the panel · corner-resize
- 🔄 triggers the dashboard's own refresh for an instant re-pull
- 💾 exports the current full dataset to CSV
- 💬 on the Flags row hands that queue's flags to the companion send hook
- Expand any chip (🟢 ☕ 🍽️ 🎯 📞 🚨 📋 ⏭️) for sorted agent rows
| Role | Value |
|---|---|
| Real-Time Analysts | Occupancy & staffing state across all queues at a glance |
| Workforce Management | Routing profile trends, staffing imbalances, CSV for planning |
| Operations Managers | Live queue health and compliance risk without opening six tabs |
| Team Leads | Individual agent status and flag follow-ups |
- v3.1 — queue filters · queue search · longest-available tracking
- v3.2 — queue health indicators · staffing-risk detection · occupancy threshold alerts
- v4.0 — screenshot mode · alert center · historical snapshots & trend analysis
JavaScript · Tampermonkey · Amazon Connect Analytics · fetch interception · HTML/CSS — 100% client-side.
The distribution build is currently private while internal thresholds and routing structures are sanitized. This repository documents the tool's capabilities, architecture, and roadmap — no production data, credentials, or company-sensitive logic is included.
Your whole floor. One panel. Zero backend.